If you've purchased a home and have or plan to have children, one factor at the forefront of your calculus is school quality. It also comes with a price. We were surprised to discover that an early study of this relationship focused on New Jersey. In 1969, economist Wallace Oates examined 53 northeastern New Jersey municipalities and found that higher per-pupil school spending was associated with higher median home values, after accounting for property taxes and other local characteristics (Oates, 1969). Later studies tightened the comparison. Those that compare homes on either side of the same attendance boundary tend to find smaller premiums than standard comparisons do (Downes, 2009). One review puts the premium in studies of this kind at under 4% of a home's value for a one-standard-deviation rise in a school's average test scores (a statistician's unit for distance from the average), or up to $24,000 on a $600,000 house (Nguyen-Hoang & Yinger, 2011). We pulled the main estimates into the table below.
What school quality adds to a home’s price
| Change in the school measure | Estimated effect on home value | On a $600,000 home | Source |
|---|---|---|---|
| One-standard-deviation rise in a school’s average test scores, review of fixed-effects and boundary studies | Under 4% | Up to $24,000 | Nguyen-Hoang & Yinger (2011) |
| The same rise in test scores, districts in and around Memphis | About 2% to 3% | $12,000 to $18,000 | Collins & Kaplan (2022) |
| 1% increase in total per-pupil school spending, U.S. districts, 1990–2015 (taxes not held constant) | About 0.95% | About $5,700 | Bayer et al. (2021), Table 3 |
| One-point higher GreatSchools rating (1 to 10 scale), Greater Houston asking prices | About 3.6% to 4.7% | About $21,500 to $27,900 | Narayanasamy et al. (2026) |
Dollar figures apply each estimate to a $600,000 home for illustration. Because the estimates reflect different U.S. geographies, time periods, and methods, they are not directly comparable. The Houston row is per rating point on asking prices, not per standard deviation of test scores. The spending row covers all categories of school spending, using changes driven by state school finance reforms, and applies to increases of roughly 5% to 10%. Holding local property tax revenue constant barely changes it (0.94%). Spending on salaries drives the effect: a 1% tax-financed increase in salary spending raised house prices by about 0.95% to 1.03% (Bayer et al., 2021, Tables 6 and 7).
What buyers are paying for
So what are buyers paying for? When the Los Angeles Times published value-added scores (estimates of how much a school or teacher raised students' scores) for the city's schools and teachers, home prices didn't respond to them (Imberman & Lovenheim, 2016). A study of school-boundary changes in suburban Memphis found that greater school-level racial diversity reduced home values, independent of measured academic performance and local district administration (Collins & Kaplan, 2022). The ratings families rely on show the same pattern. A National Education Policy Center review of the research found that school ratings track students' race, ethnicity and socioeconomic status. The link is strongest for one-moment performance measures and weaker, but present, for growth measures, which track how students' scores change over time. Parents who consult ratings often lean on those one-moment measures, and the review notes that they tend to steer away from racially diverse schools (Powers, 2023).
Labels have a price of their own. Figlio and Lucas (2004) found that Florida's A-to-F school grades moved house prices separately from the test scores behind them. In the Cleveland suburbs of Cuyahoga County in 2005, home prices differed by roughly 5% for each step in Ohio's district report-card ratings: 4.8% higher in districts rated Excellent than in those rated Effective, and 5.5% and 11% lower in districts rated Continuous Improvement and Academic Watch respectively (Seo & Simons, 2009). Similarly, after GreatSchools ratings became available online, zip codes with stronger test results pulled further ahead of average-performing zip codes in home values and in the shares of high-income households and college-educated residents (Hasan & Kumar, 2024). The newest evidence places a number on the label itself. In Greater Houston, a one-point higher GreatSchools rating for a home's assigned high school went with a listing price about 4.6% higher, while the state's own accountability score was indistinguishable from zero once the rating was in the model. The authors don't call that causal. They note that the rating may simply summarize who lives in the neighborhood (Narayanasamy et al., 2026).
Uncertainty shows up in prices as well. In Orange County, Florida, homes reassigned to a different school attendance zone more than once over about a decade sold at about a 2.9% discount (Turnbull et al., 2018).
How a GreatSchools rating is built
A rating like GreatSchools compresses several measures into one number. The overall score draws on up to three themed ratings: Student Progress, Test Score and, for high schools, College Readiness, each ranked against other schools in the state (GreatSchools, 2026). The Student Progress Rating starts from the state’s own student growth data when those data are available and usable. GreatSchools converts them into statewide percentiles on its own 1-to-10 scale rather than reproducing the state’s measure. Where a state’s growth data fall short, it substitutes an Academic Progress Rating, which compares a school’s proficiency rates with what similar schools, matched on prior scores, income and race and ethnicity, would be expected to post. The overall rating then gives extra weight to whichever of the progress and test score ratings is higher. What goes into the rating matters because test-based measures also reflect whom a school enrolls.
In a national analysis published in 2021, GreatSchools' overall rating tracked its Test Score component almost one-for-one (r = .94) and was associated with student poverty (Gillani et al., 2021). State accountability indicators also correlate strongly with student demographics, and the labels built on them can influence which neighborhoods families choose (Noonan & Schneider, 2022). In Denver and New York City middle schools, the relationship between school performance ratings and White enrollment largely reflected differences in whom schools enrolled, rather than how much they contributed to student learning (Angrist et al., 2024).
West Orange’s ratings, school by school
West Orange has seen this before. A 2013 law review study found that West Orange High ranked 252nd on SchoolDigger's aggregate test scores in 2010 but 109th when ranked on the scores of its White students alone (Glynn & Waldeck, 2013). SchoolDigger uses an older, test-score-based ranking system and is distinct from GreatSchools, but the broader lesson still applies: ratings can reflect differences in student populations as much as differences in school performance. Looking at whom each school serves, how its results have changed over time, and how student subgroups fare provides context that a single number cannot.
The distinction between the components matters here too. GreatSchools reports Student Progress and Test Score Ratings separately, and progress measures are less closely associated with student demographics than test scores are (Powers, 2023). Hazel Avenue and Washington have the two highest shares of economically disadvantaged students among the elementary schools (NJDOE, n.d.). On GreatSchools’ 1-to-10 scale, Hazel Avenue’s Test Score Rating is 6 and its Student Progress Rating is 8, for an overall GreatSchools rating of 8. Washington’s are 5 and 4, for an overall rating of 5. For comparison, Edison Middle School, where 44.3% of students are economically disadvantaged, has ratings of 7 and 4, for an overall rating of 6 (GreatSchools, n.d.).
Each overall rating blends the two components, but the school profiles do not show families how much each one contributes. A school may perform differently on test scores and student progress, and those distinctions matter when interpreting its overall score. Context tells us whom a school serves. A progress rating offers another perspective: how students are progressing academically relative to expectations. It adds information about learning trajectories, but it should not be read as a stand-alone causal estimate of a school’s contribution (Castellano & Ho, 2013).
What is the number leaving out
We built a diagnostic tool for West Orange's public schools this year, bringing together ten years of New Jersey Department of Education (NJDOE) School Performance Report data for eleven schools, including eight years of test results, with Census data on neighborhood conditions (NJDOE, n.d.). The framework draws on Bronfenbrenner's (1979) ecological systems theory, which situates individual development within the environments and institutions surrounding it. Bishop and Noguera (2019) make a related case for education policy, arguing that approaches such as No Child Left Behind, which made academic achievement the primary measure of school progress, have had limited impact in low-income communities because they leave the social and economic conditions associated with poverty largely unaddressed.
A proficiency rate means little on its own. Its interpretation changes when considered alongside the conditions surrounding students (e.g., the classroom, the school's resources, and the neighborhood a student returns to after school). The tool brings these layers together to examine where indicators reinforce one another, where they diverge, and what a single measure might miss.
Context is not the only thing a test score leaves out. Schools also influence outcomes that proficiency rates do not capture. Research on ninth-grade teachers in North Carolina found that their effects on attendance, behavior, course performance, and grade progression predicted longer-run student outcomes beyond what their effects on test scores captured (Jackson, 2018). A clearer picture necessitates that we examine not only who attends a school, but what kinds of outcomes we count.
Before looking at individual schools, it helps to establish the wider district context. West Orange performs above state averages. In 2024-25, district ELA proficiency was 63.4%, compared with 53.0% statewide. Math proficiency was 48.9%, compared with 42.0% (NJDOE, 2026). The district's advantage over the state has widened each year since 2021-22, from 5.2 to 10.4 percentage points in ELA and from 0.4 to 6.9 points in math (calculated from the same trend chart).
Statewide comparisons provide a useful reference, but they also have limits. State averages combine districts serving communities with very different resources and circumstances. They can obscure variation among districts and offer little indication of what the results mean for the eleven schools within West Orange. The rest of this examination stays inside the district.
When a finding flips
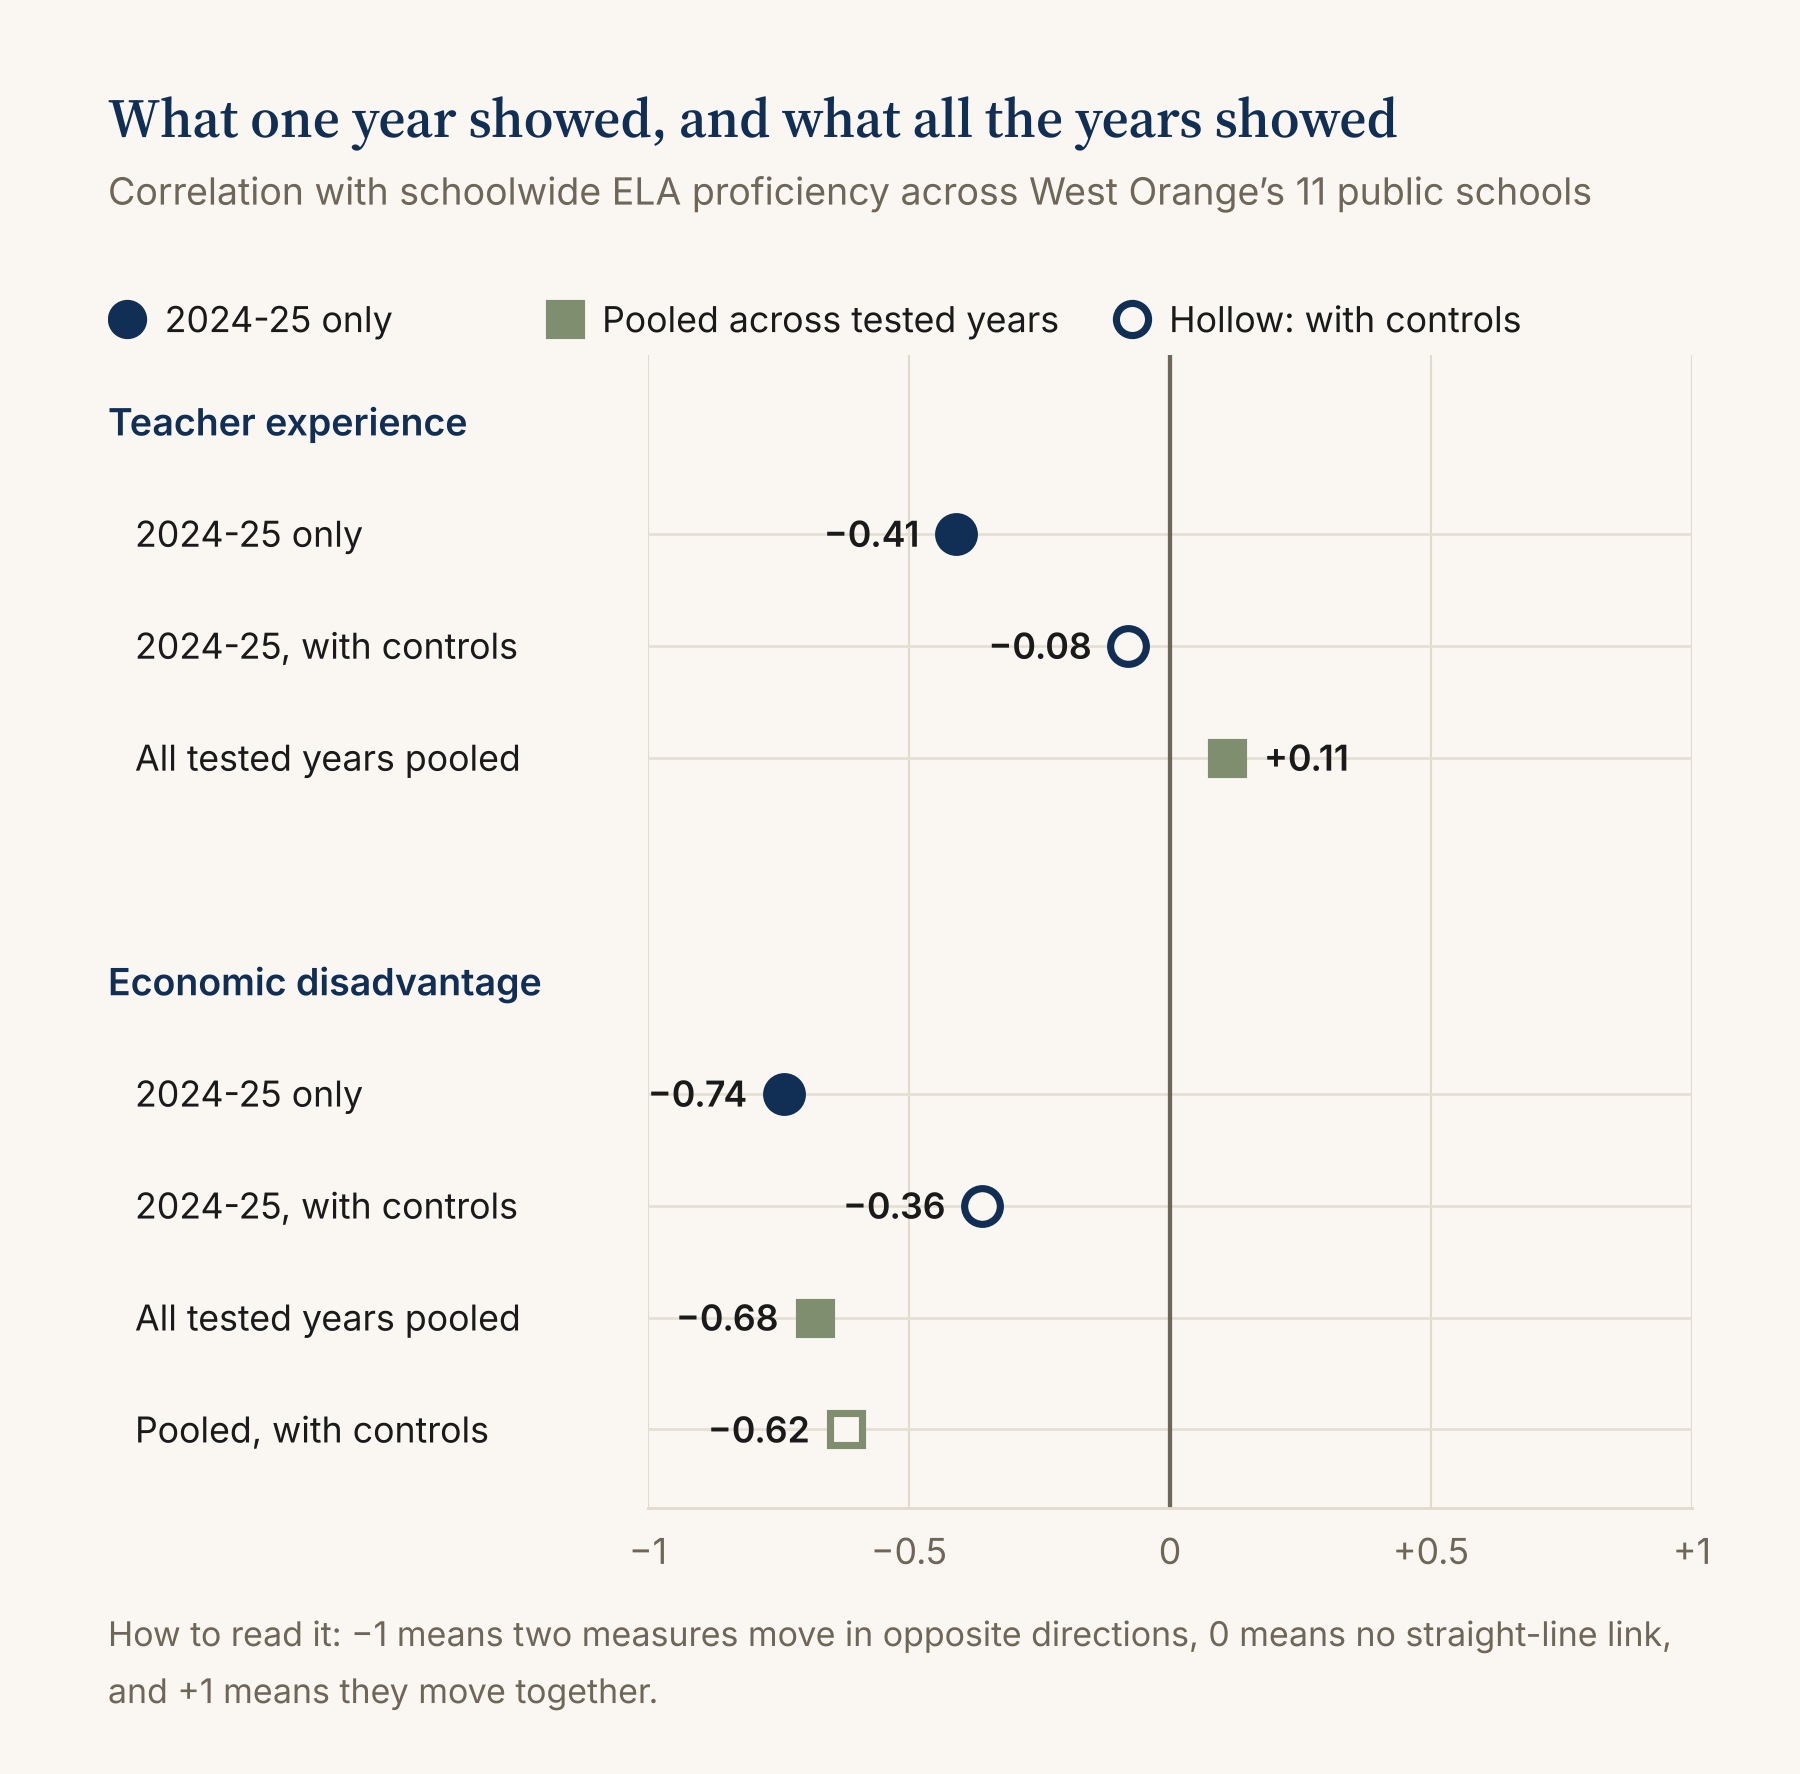
In 2024-25, average teacher experience correlated with schoolwide ELA proficiency at r = -0.41 across the eleven schools. More experienced staff, lower scores. At first glance, that appears inconsistent with research on individual teachers. Podolsky et al. (2019) reviewed 30 U.S. studies published since 2003 and found that teaching experience is positively associated with student achievement gains through much of a career, with the steepest gains in the first few years. We didn't take the finding at face value.
So we controlled for enrollment and for the shares of economically disadvantaged students, students with disabilities, and multilingual learners. The correlation fell to r = -0.08. Then we did what we should have done initially and examined every year. Pooled across the seven years with both measures, the correlation is +0.11, and +0.18 after controlling for the three student-share measures. The direction changes. Enrollment is available for only one year, so the pooled estimates can't account for it. None of these estimates is statistically distinguishable from zero, and eleven schools, statistically speaking, is a small room to hold an argument in. What we had was a one-year pattern that reversed when we widened the frame. Two cautions apply. The research examines individual teachers (Podolsky et al., 2019), while a school's average years of teacher experience is a much cruder proxy. Also, repeated observations from the same schools are not independent, so the pooled correlation should be read as descriptive, not as an independent statistical test.
Economic disadvantage told a different story. In 2024-25 its correlation with ELA proficiency was -0.74, and it dropped to -0.36 once we accounted for disability and multilingual learner shares. Taken alone, that looks like a relationship that shrinks under scrutiny. Across all years, however, it doesn't. Pooled, the correlation is -0.68, and -0.62 with the same controls. Economic disadvantage was strongly (negatively) associated with ELA proficiency across the pooled school-year observations, even after accounting for differences in disability and multilingual learner enrollment. Unlike the single-year estimate, the pooled results show that this association persists across a longer time frame.
We want to be cautious about what that number means. The persistent association between economic disadvantage and ELA proficiency should not be interpreted as a causal estimate of the effect of poverty, nor as evidence that schools alone produce the gap. Socioeconomic differences in reading and math skills are already substantial at kindergarten entry (Reardon & Portilla, 2016), reflecting unequal access to early learning conditions and other family and neighborhood resources before children arrive at school (Coley et al., 2025). At the same time, poverty is not merely a background condition. It is spatially and institutionally concentrated. Children from lower-income households are more likely to live in lower-resource neighborhoods and attend schools serving larger shares of economically disadvantaged students, patterns linked to lower achievement and wider disparities (Coley et al., 2025).
For added clarity, none of this means that schools or their resources are incidental. Research using school-finance reforms has found that increased spending can improve educational attainment and adult economic outcomes, particularly for children from low-income families (Jackson et al., 2016). The point of adding context is not to explain away differences in outcomes, but to avoid mistaking those differences for a clean measure of school effectiveness.
Where economic disadvantage and ethnicity overlap
West Orange's seven elementary schools show how tangled the layers get. Economic disadvantage tracks Hispanic share of enrollment, NJDOE's category, at r = 0.99. Washington Elementary is 76.5% economically disadvantaged and 61.6% Hispanic, with ELA proficiency of 52.3%. St. Cloud is 14.7% economically disadvantaged, with ELA proficiency of 76.2%. With the two moving together that closely, neither the tool nor our controls can pull class apart from race and ethnicity, and no regression on seven schools can separate them. The overlap, however, has a shape. Black enrollment varies far less from one elementary school to the next, between 23.7% and 34.2% in 2024-25, while Hispanic enrollment runs from 20.5% at St. Cloud to 61.6% at Washington. The Segregation Tracking Project's measures of segregation between schools reinforce this pattern at the district level. West Orange's White-Hispanic segregation measure, which captures how differently White and Hispanic students are distributed across schools, ranked among the highest in New Jersey in every year from 2019-20 through 2023-24. Its White-Black segregation measure was roughly half as large (Reardon et al., 2026).
Research in neighboring Passaic County points to a related pattern. Across 132 schools, lower-performing schools were located in lower-resourced neighborhoods, and both school characteristics and neighborhood resource deprivation were associated with lower math and English performance (Opara et al., 2023). School attendance boundaries can also carry patterns of residential segregation into schools. Across U.S. metropolitan areas, researchers identified 2,373 racially unequal school boundaries. On the side with larger shares of Black and Hispanic students, 82% of students qualified for free or reduced-price lunch, compared with 40% on the other side (Monarrez & Chien, 2021). Differences between neighboring schools, then, may reflect more than what happens inside their buildings. They can also reflect where students live, how residential patterns shape school enrollment, and the resources available to their families.
Following a school over time is not the same as following its students. Annual proficiency rates describe successive tested populations. Student-growth measures examine changes in students’ performance over time. Our analysis uses the former. It can identify changes that warrant investigation, but it cannot establish how much an individual student learned or how much of that learning a school caused (Castellano & Ho, 2013).
The Kelly Elementary puzzle
Kelly Elementary complicates the picture further. A school administrator confirmed that Kelly is a current district placement site, serving students from outside its attendance zone (personal communication, October 28, 2026). Students in its twelve Learning and/or Language Disabilities classrooms, two at each grade from kindergarten through fifth, and its two primary autism classrooms are mostly taught in self-contained rooms, joining general education peers when an IEP allows. A kindergarten inclusion class also draws from across the district, and three resource rooms serve Kelly's own students. So the split below mostly tracks where students sit, not just who is counted. Because placed students are enrolled at Kelly, they count in its numbers rather than their home schools’. NJDOE doesn’t report them separately, so the neighborhood data in our tool describe Kelly’s attendance zone, not every student in the building.
A schoolwide rate is an average of two groups, and a building with a large share of one can move the whole number. Backed out of the reported rates, students with disabilities are about 29% of the students behind Kelly's ELA rate and about 22% at the other six elementary schools. That difference is worth about 3 of the 18-point ELA gap and about 2.7 of the 9.6-point math gap, measured against the average of the other six. In the four years where every school reports the needed figures, composition accounts for between 14% and 43% of the gap. It's never most of it.
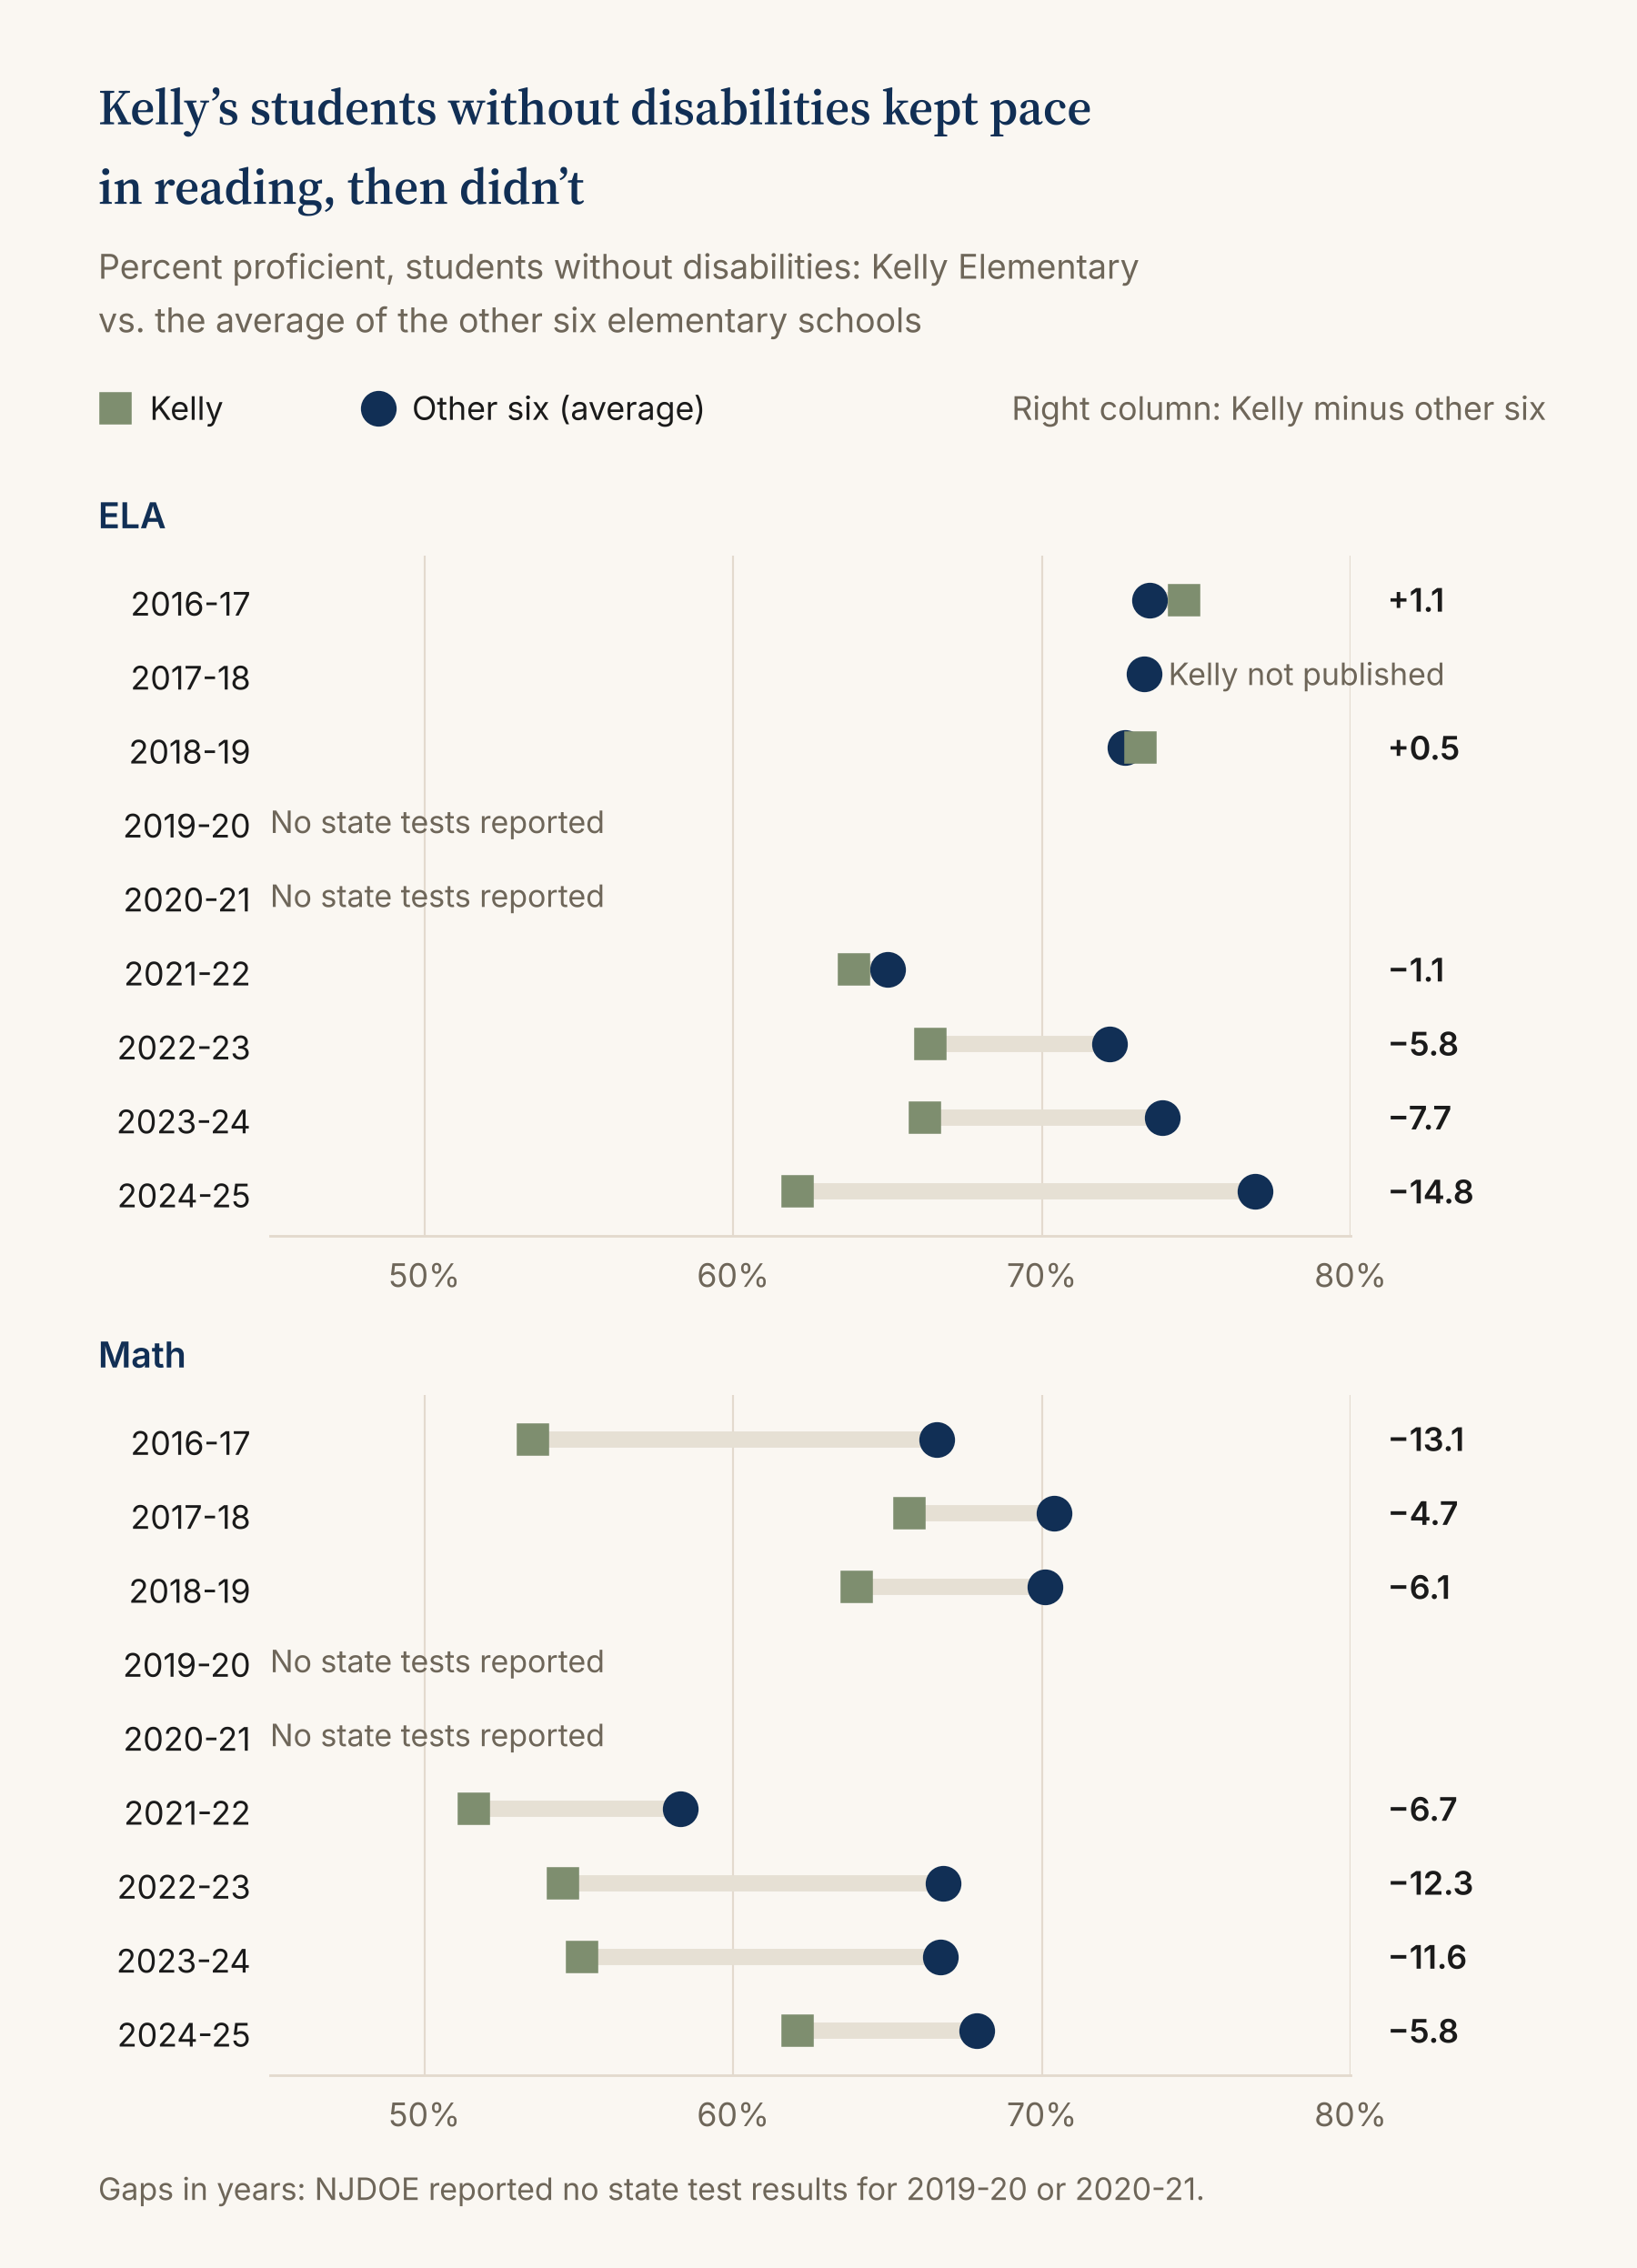
Split out students without disabilities and Kelly's rate is 62.1% in ELA and 62.1% in math. The same number twice, and we verified it against the NJDOE report (NJDOE, 2026). The average of the other six is 76.9% in ELA and 67.9% in math. In math, Kelly's students without disabilities trailed that average in all seven years the subgroup is published, by about 5 to 13 points. In ELA they were within about a point of it from 2016-17 through 2021-22. Then the other six pulled ahead while Kelly's stayed roughly flat and dipped in 2024-25, leaving gaps of 5.8, 7.7, and 14.8 points. Kelly's share of students with disabilities was about the same in the years we can compute, so composition doesn't explain that timing. Multilingual learners don't explain it either. They are 10.2% of Kelly's students against 8.7% on average at the other six in 2024-25, and Kelly's share has run 1.5 to 4.2 points above that average since 2018-19. Even if none of the extra multilingual learners were proficient, a difference that size would move the rate by a point or two at most. The data can't tell us what does. That leaves questions for follow-up, not findings: did staffing or scheduling change in a building that houses this many specialized programs, and did the mix of students without disabilities who attend Kelly shift?
Reading a number in context
None of this is a criticism of dashboards. The problem is a number with nothing beside it to give it context. A proficiency rate presented on its own invites conclusions it cannot support. Percent-proficient statistics depend heavily on where the cut score is set (Ho, 2008), and interpreting trends requires attention to changes in the population being tested. Ho (2025) shows how changes in who is tested can mask real declines in performance and widening achievement gaps.
The tool puts ELA and math in the same row as the factor you're examining and lets you toggle the outcome to watch a relationship hold or disappear. It prompts a second question before anyone settles on a first answer.
That is the praxis we try to bring to every As-I-Am Consulting Group engagement. Before recommending how a system might improve, we need to understand which conditions are associated with the outcomes, which layers of the system may be contributing to the pattern, and how confident we can be in that interpretation.
In consulting work, it is not unusual to meet institutions sitting on years of data they have never cross-examined.
We still don't know what accounts for the rest of Kelly's gap, and we'd rather say so than dress up a guess.
Notes on the numbers
Pearson correlations across schools, from NJDOE School Performance Reports (NJDOE, n.d.) compiled in the wo-schools-data repository (Asiamah, 2026). ELA proficiency is unreported for 2019-20 and 2020-21, and teacher experience for 2015-16. The teacher experience correlation pools seven years (77 school-year observations: 2016-17, 2017-18, 2018-19, 2021-22, 2022-23, 2023-24, 2024-25). The pooled partial correlation controls for economic disadvantage, disability and multilingual learner shares. Enrollment, used only in the 2024-25 estimate, is a single 2025-26 snapshot (Kiefer, 2026) and cannot vary by year. The economic disadvantage correlations pool eight years (88 school-year observations: 2015-16 through 2018-19 and 2021-22 through 2024-25). Kelly's rates for students without disabilities are published for six years in ELA (2016-17, 2018-19, and 2021-22 through 2024-25) and seven in math (2016-17 through 2018-19 and 2021-22 through 2024-25). The composition decomposition uses only years in which every elementary school reports all three rates: 2016-17, 2018-19, 2022-23, and 2024-25 in ELA, and 2016-17, 2017-18, 2018-19, and 2024-25 in math. District and state rates are from the trend chart in the 2024-25 School Performance Report for Kelly Elementary (NJDOE, 2026). The comparator for Kelly is the unweighted mean of the other six elementary schools. Medians differ: in 2024-25 they are 70.6% (schoolwide ELA) and 77.6% (students without disabilities, ELA). The share of tested students with disabilities is backed out from the three reported rates, assuming a schoolwide rate is the weighted average of its two group rates, so it can be off where NJDOE's participation adjustment or suppression applies. NJDOE does not display results for groups of fewer than 10 students or proficiency rates below 10%, which removes some years from the Kelly comparisons. Proficiency is NJDOE's federal rate: the share scoring Level 4 or 5 on the NJSLA or Level 3 or 4 on the Dynamic Learning Maps alternate assessment, adjusted when participation falls below 95% (NJDOE, 2026), so schoolwide rates blend two assessments. The multilingual-learner shares come from the same School Performance Reports. The "point or two" bound multiplies the share difference by a proficiency rate near the district level and assumes the share among students without disabilities is close to the schoolwide share. District segregation figures are two-group normalized exposure indices from the Segregation Tracking Project (Reardon et al., 2026), computed within each grade and averaged across grades, so West Orange's single high school adds no between-school segregation for grades 9 through 12. "Ranked among the highest" means that of the roughly 275 New Jersey districts with a nonzero value, 7 to 12 ranked higher in each year from 2019-20 through 2022-23, and 5 of 186 did in 2023-24. GreatSchools ratings are as shown on each school's profile page on November 1, 2026. The Gillani et al. (2021) figures describe GreatSchools ratings before the company's later methodology updates. The Houston estimates come from 2,332 asking prices collected on one day in November 2025, matched to the rating of each home's assigned high school. The table's dollar figures are our arithmetic: 3.59% (the 27-group regression) and 4.65% (with district fixed effects) bracket the preferred 4.57% estimate.
References
Angrist, J., Hull, P., Pathak, P. A., & Walters, C. R. (2024). Race and the mismeasure of school quality. American Economic Review: Insights, 6(1), 20–37. https://doi.org/10.1257/aeri.20220292
Asiamah, D. (2026). wo-schools-data [Data set]. GitHub. https://github.com/AsIAm04/wo-schools-data
Bayer, P., Blair, P. Q., & Whaley, K. (2021). Are we spending enough on teachers in the U.S.? (NBER Working Paper No. 28255, revised October 2021). National Bureau of Economic Research. https://doi.org/10.3386/w28255
Bishop, J. P., & Noguera, P. A. (2019). The ecology of educational equity: Implications for policy. Peabody Journal of Education, 94(2), 122–141. https://doi.org/10.1080/0161956X.2019.1598108
Bronfenbrenner, U. (1979). The ecology of human development: Experiments by nature and design. Harvard University Press.
Castellano, K. E., & Ho, A. D. (2013). A practitioner’s guide to growth models. Council of Chief State School Officers.
Coley, R. L., McCoy, D. C., & Hatch, S. F. (2025). How poverty shapes children's home, neighborhood, and school environments: An integrative conceptual framework and review. American Psychologist. Advance online publication. https://doi.org/10.1037/amp0001573
Collins, C. A., & Kaplan, E. K. (2022). Demand for school quality and local district administration. Economics of Education Review, 88, Article 102252. https://doi.org/10.1016/j.econedurev.2022.102252
Downes, T. A. (2009). The impact of education reforms on property values: A review of the literature (Working Paper WP09TD1). Lincoln Institute of Land Policy. https://www.lincolninst.edu/app/uploads/2024/04/1658_873_downes_final.pdf
Figlio, D. N., & Lucas, M. E. (2004). What's in a grade? School report cards and the housing market. American Economic Review, 94(3), 591–604. https://doi.org/10.1257/0002828041464489
Gillani, N., Chu, E., Beeferman, D., Eynon, R., & Roy, D. (2021). Parents' online school reviews reflect several racial and socioeconomic disparities in K–12 education. AERA Open, 7(1), 1–16. https://doi.org/10.1177/2332858421992344
Glynn, T. P., & Waldeck, S. E. (2013). Penalizing diversity: How school rankings mislead the market. Journal of Law & Education, 42(3), 417–500.
GreatSchools. (2026, April 15). GreatSchools ratings methodology report. https://www.greatschools.org/gk/about/ratings-methodology/
GreatSchools. (n.d.). [School profile pages for Edison, Hazel Avenue and Washington elementary schools]. Retrieved November 1, 2026, from https://www.greatschools.org/
Hasan, S., & Kumar, A. (2024). Who captures the value from organizational ratings? Evidence from public schools. Strategy Science, 9(3), 248–266. https://doi.org/10.1287/stsc.2023.0113
Ho, A. D. (2008). The problem with "proficiency": Limitations of statistics and policy under No Child Left Behind. Educational Researcher, 37(6), 351–360. https://doi.org/10.3102/0013189X08323842
Ho, A. D. (2025). Three metrics for monitoring educational progress when tested populations change. Teachers College Record, 127(6–7), 157–178. https://doi.org/10.1177/01614681251378289
Imberman, S. A., & Lovenheim, M. F. (2016). Does the market value value-added? Evidence from housing prices after a public release of school and teacher value-added. Journal of Urban Economics, 91, 104–121. https://doi.org/10.1016/j.jue.2015.06.001
Jackson, C. K. (2018). What do test scores miss? The importance of teacher effects on non–test score outcomes. Journal of Political Economy, 126(5), 2072–2107.
Jackson, C. K., Johnson, R. C., & Persico, C. (2016). The effects of school spending on educational and economic outcomes: Evidence from school finance reforms. The Quarterly Journal of Economics, 131(1), 157–218.
Kiefer, E. (2026, April 10). Here's how many students attend each West Orange school. West Orange, NJ Patch. https://patch.com/new-jersey/westorange/here-s-how-many-students-attend-each-west-orange-school
Monarrez, T., & Chien, C. (2021). Dividing lines: Racially unequal school boundaries in US public school systems. Urban Institute.
Narayanasamy, A., Panta, H., & Devkota, M. (2026). Capitalizing consumer school ratings into residential listing prices: Evidence from Greater Houston. International Journal of Housing Markets and Analysis. Advance online publication. https://doi.org/10.1108/IJHMA-07-2026-0273
New Jersey Department of Education. (2026). Kelly Elementary School (13-5680-150): ELA and mathematics assessments: Overall participation and performance, SPR year 2024-25 [Data dashboard]. https://www.nj.gov/education/spr/
New Jersey Department of Education. (n.d.). School performance reports. https://www.nj.gov/education/spr/
Nguyen-Hoang, P., & Yinger, J. (2011). The capitalization of school quality into house values: A review. Journal of Housing Economics, 20(1), 30–48. https://doi.org/10.1016/j.jhe.2011.02.001
Noonan, J., & Schneider, J. (2022). Beyond “good” and “bad”: Disrupting narratives about school quality. Phi Delta Kappan, 104(3), 6–11. https://doi.org/10.1177/00317217221136587
Oates, W. E. (1969). The effects of property taxes and local public spending on property values: An empirical study of tax capitalization and the Tiebout hypothesis. Journal of Political Economy, 77(6), 957–971. https://doi.org/10.1086/259584
Opara, I., Thorpe, D., Lardier, D. T., & Parisi, D. (2023). Schools' neighborhoods and characteristics: Implications for standardized academic achievement in Passaic, NJ's elementary, middle and high schools. The Urban Review, 55, 393–414. https://doi.org/10.1007/s11256-022-00652-3
Podolsky, A., Kini, T., & Darling-Hammond, L. (2019). Does teaching experience increase teacher effectiveness? A review of US research. Journal of Professional Capital and Community, 4(4), 286–308. https://doi.org/10.1108/JPCC-12-2018-0032
Powers, J. M. (2023). Consumer-oriented school rating systems and their implications for educational equity. National Education Policy Center. https://nepc.colorado.edu/publication/school-ratings
Reardon, S. F., & Portilla, X. A. (2016). Recent trends in income, racial, and ethnic school readiness gaps at kindergarten entry. AERA Open, 2(3), 1–18. https://doi.org/10.1177/2332858416657343
Reardon, S. F., Owens, A., & Kalogrides, D. (2026). School segregation data (Version 2.0) [Data set]. Segregation Tracking Project, Stanford University. https://edopportunity.org/segregation/
Seo, Y., & Simons, R. A. (2009). The effect of school quality on residential sales price. Journal of Real Estate Research, 31(3), 307–328. https://doi.org/10.1080/10835547.2009.12091255
Turnbull, G. K., Zahirovic-Herbert, V., & Zheng, M. (2018). Uncertain school quality and house prices: Theory and empirical evidence. Journal of Real Estate Finance and Economics, 57(2), 167–191. https://doi.org/10.1007/s11146-017-9611-6